Two-pagers, infographics, and visual explainers
Clients: ENGIE Laborelec, ENCLUDE, mobility justice research teams
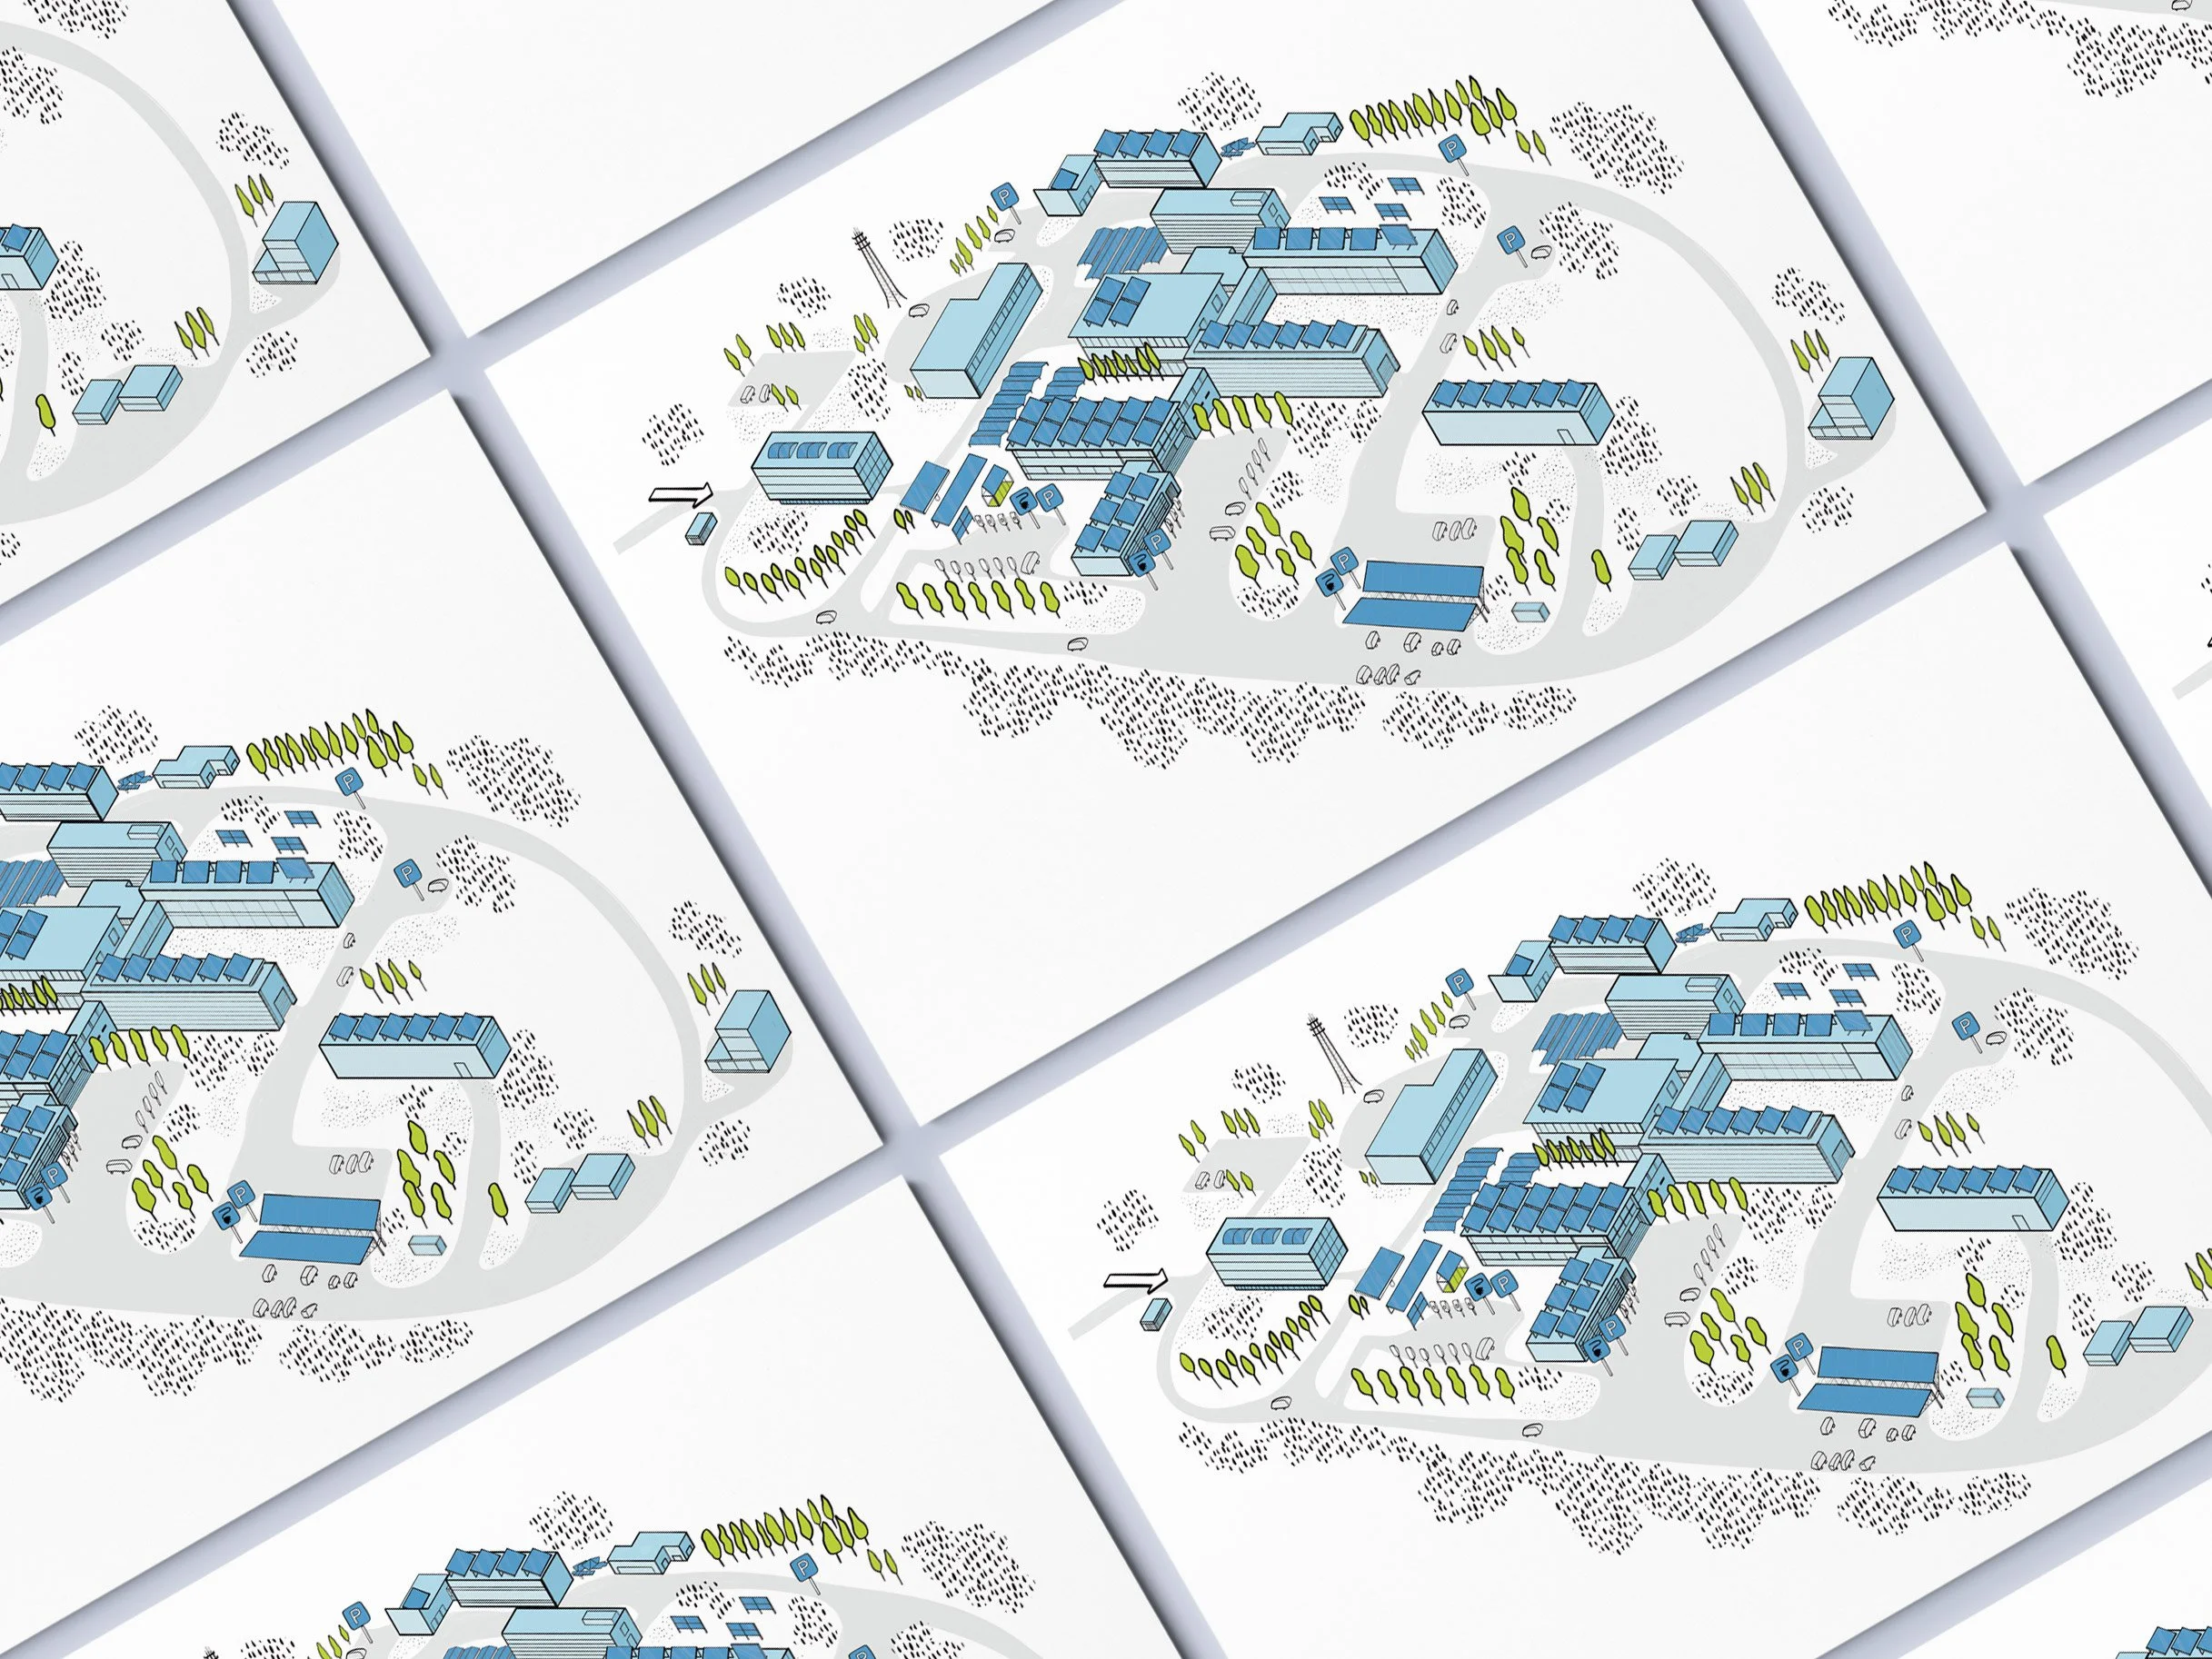
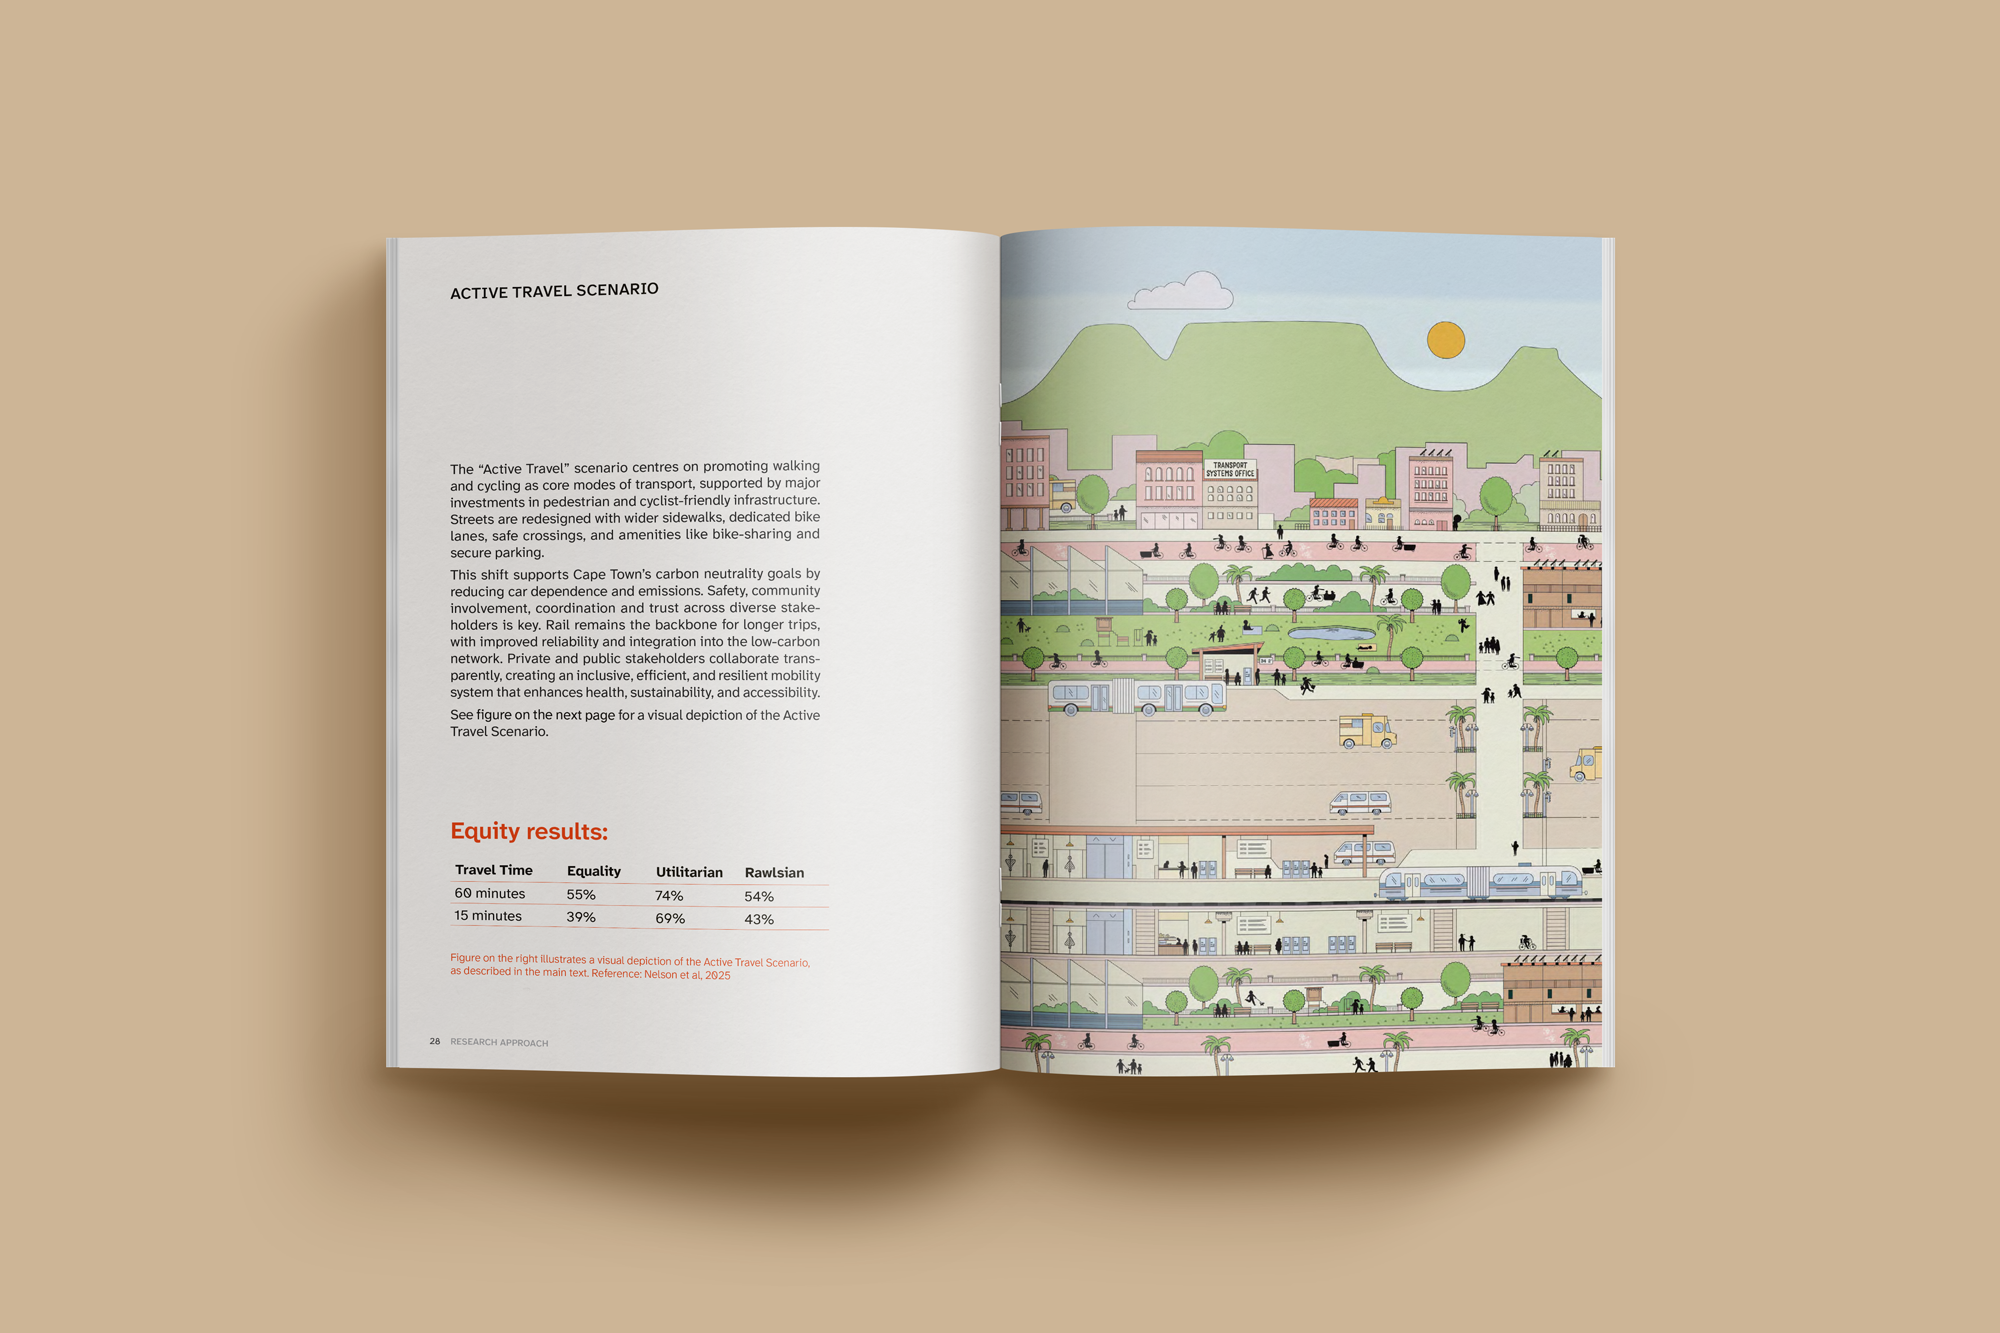
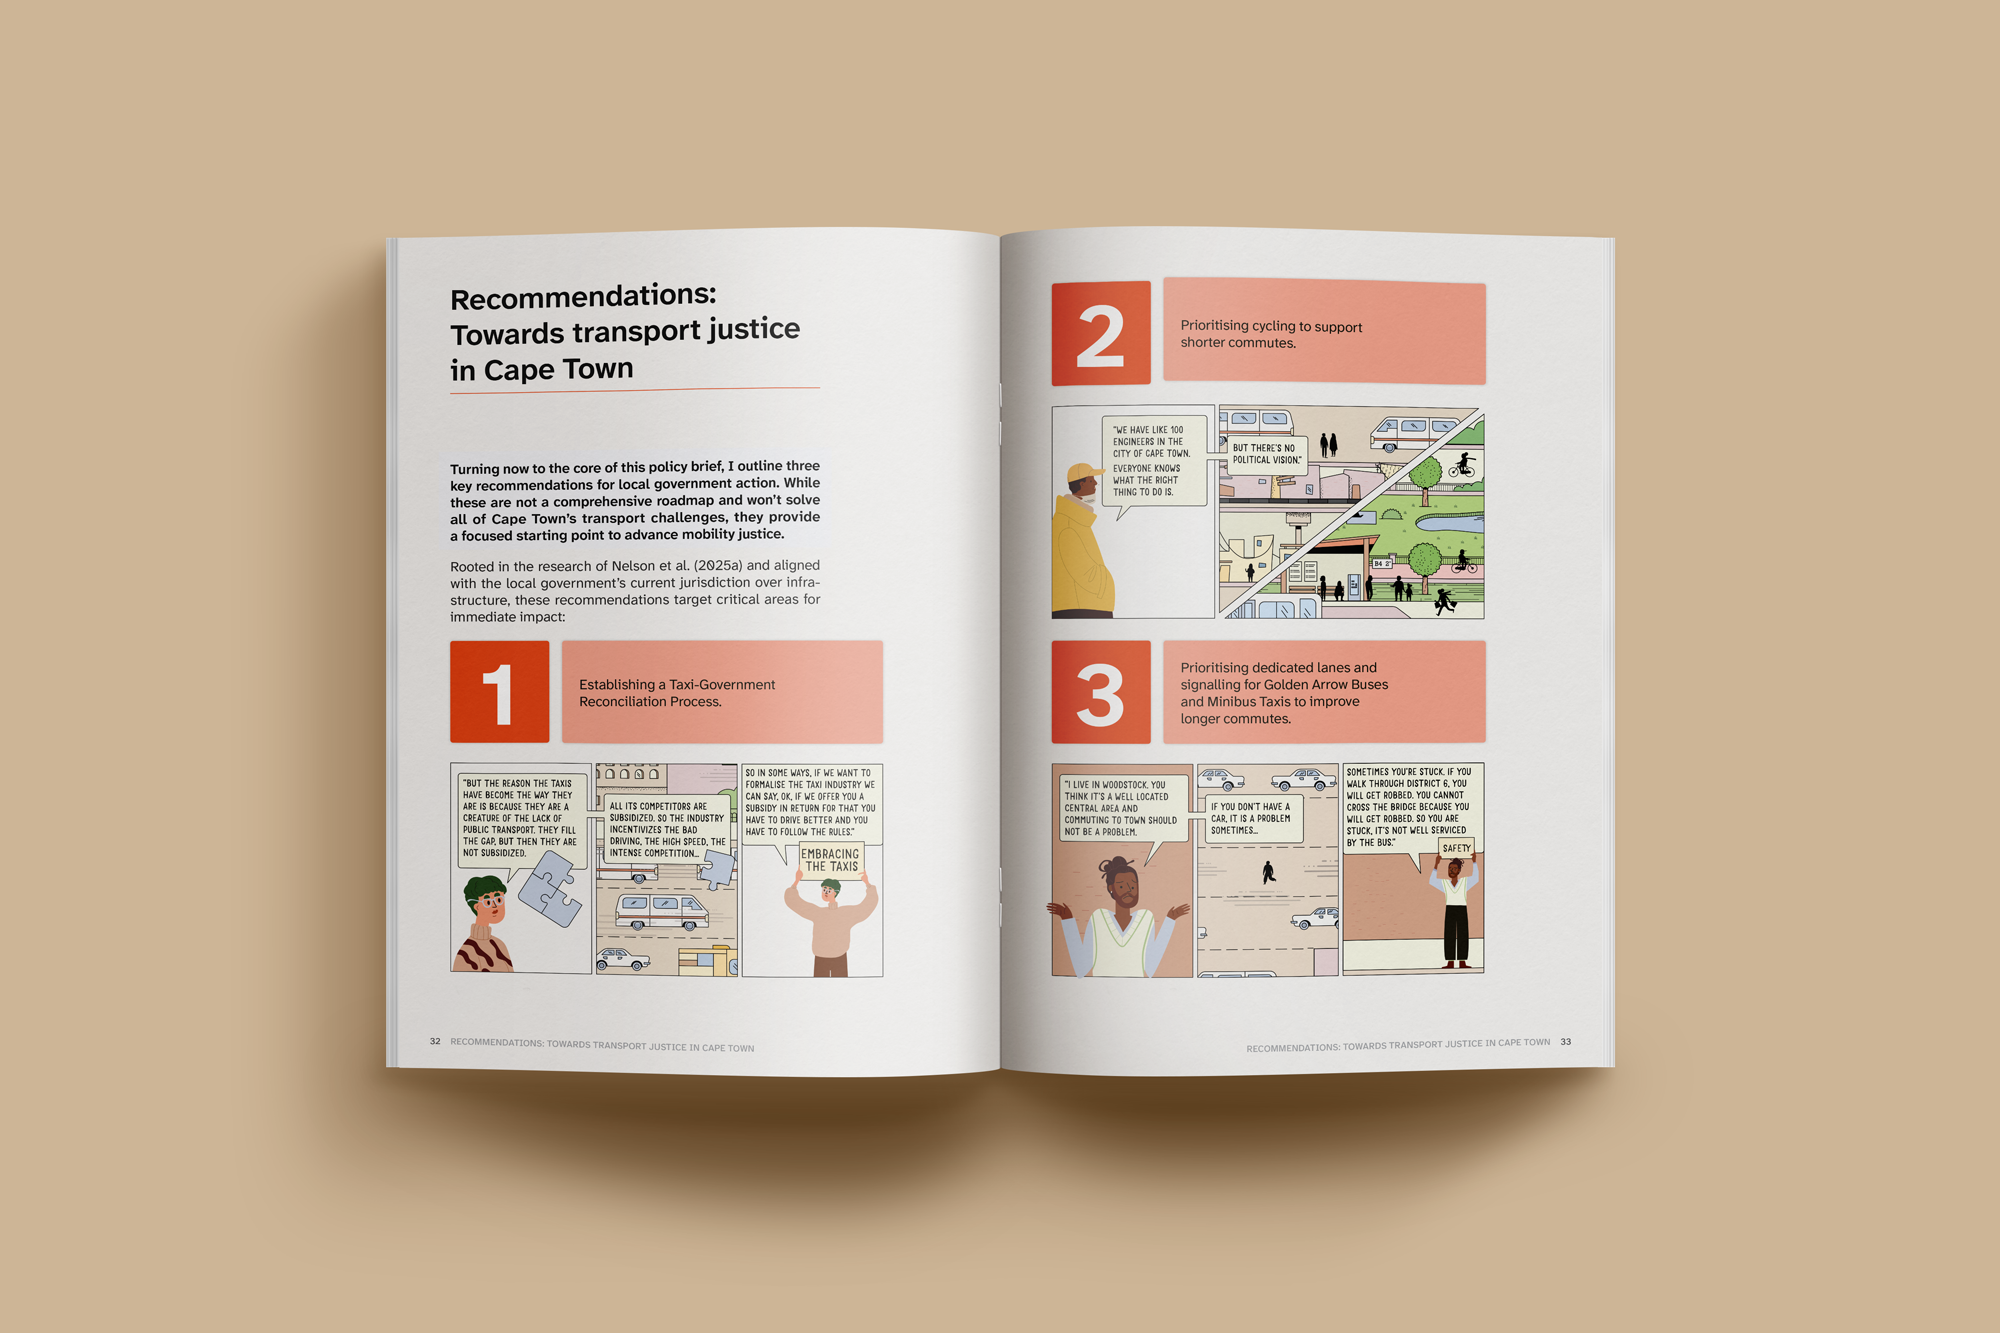
Projects: Hand-drawn site map, interactive energy-sharing flowchart, illustrated future scenarios
The Challenge
Complex systems, processes, and datasets that need to be understood fast by people who will not read a 60-page report. One page + one message. The design has to do the work the text cannot.
The Strategy
Illustrated scenarios for mobility futures. Interactive flowcharts for energy-sharing systems. A hand-drawn site map for the ENGIE Laborelec campus in Linkebeek. Each project starts with the same question: what is the single thing this visual needs to communicate, and what is the simplest form that can hold it? I build process diagrams, system maps, data visualisations, or custom illustrations, depending on what the content needs.
The Impact
Visuals used in reports, digital platforms, social media, and printed collateral. Some have been used as standalone communication tools. Several are interactive PDFs that readers can navigate without reading linearly.