Thousands terawatt-hours, in a bubble
Neil deGrasse Tyson says he's driven by wanting to know more about the world than he knew yesterday. Well, that’s also a thing with illustrating data: a picture makes you understand the numbers.
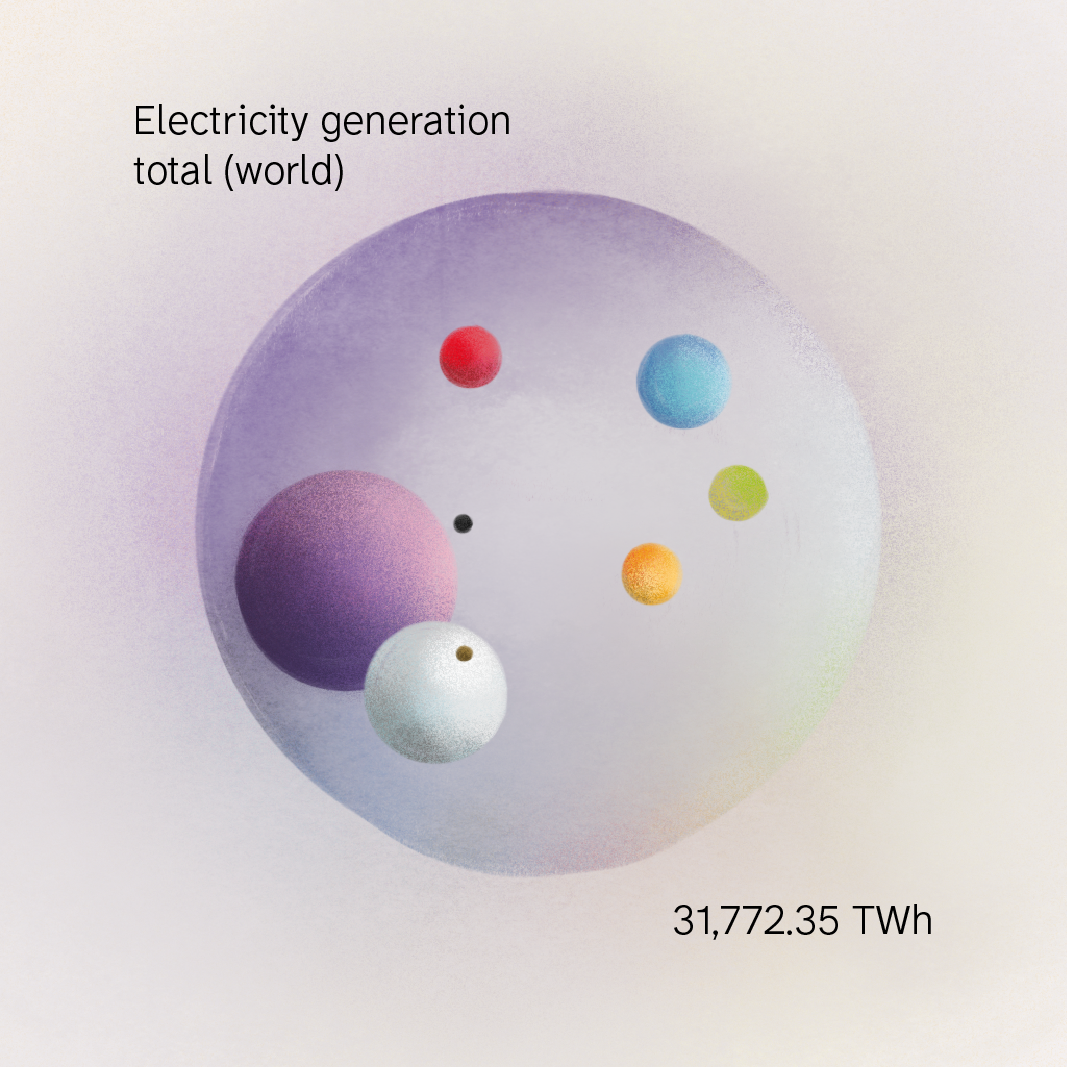
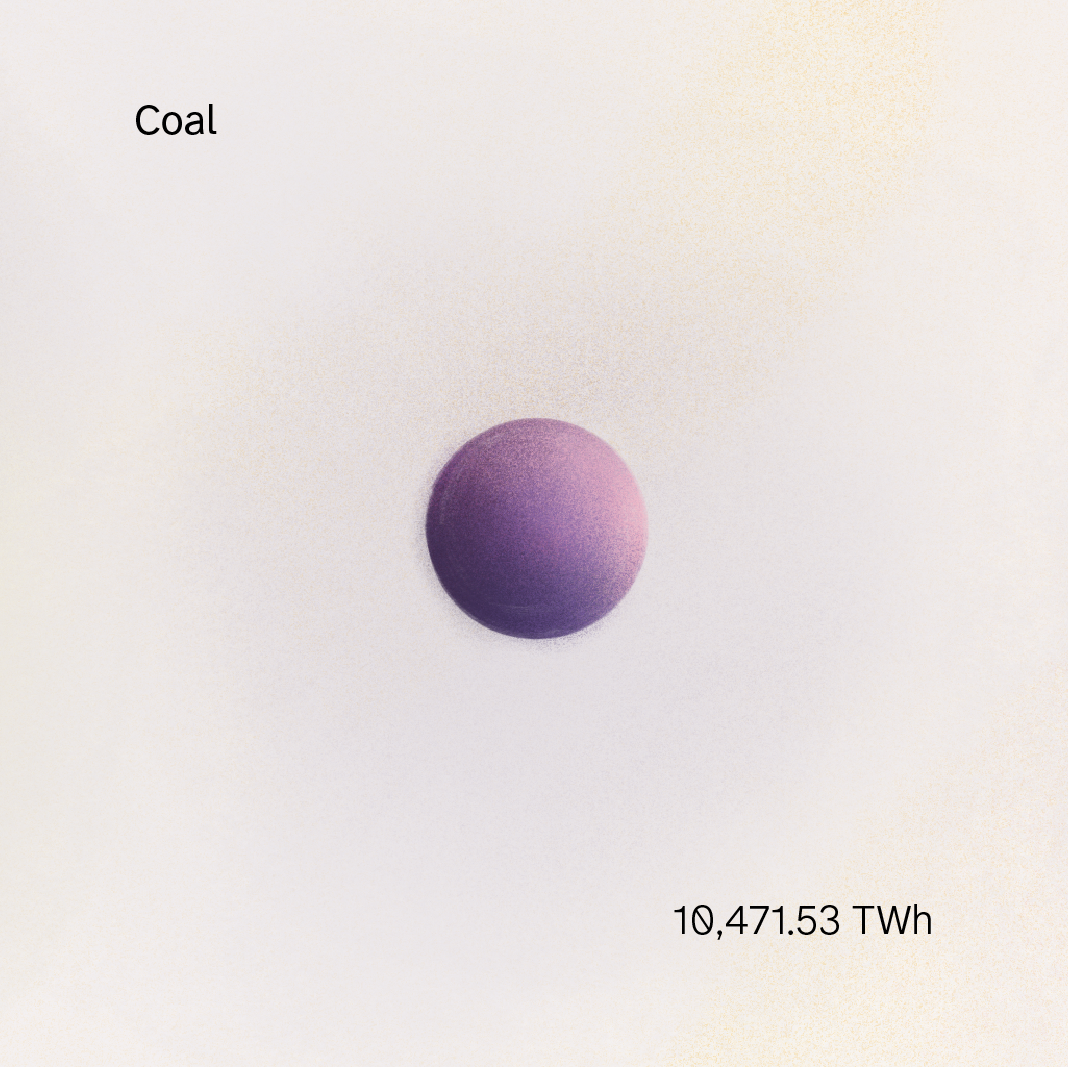
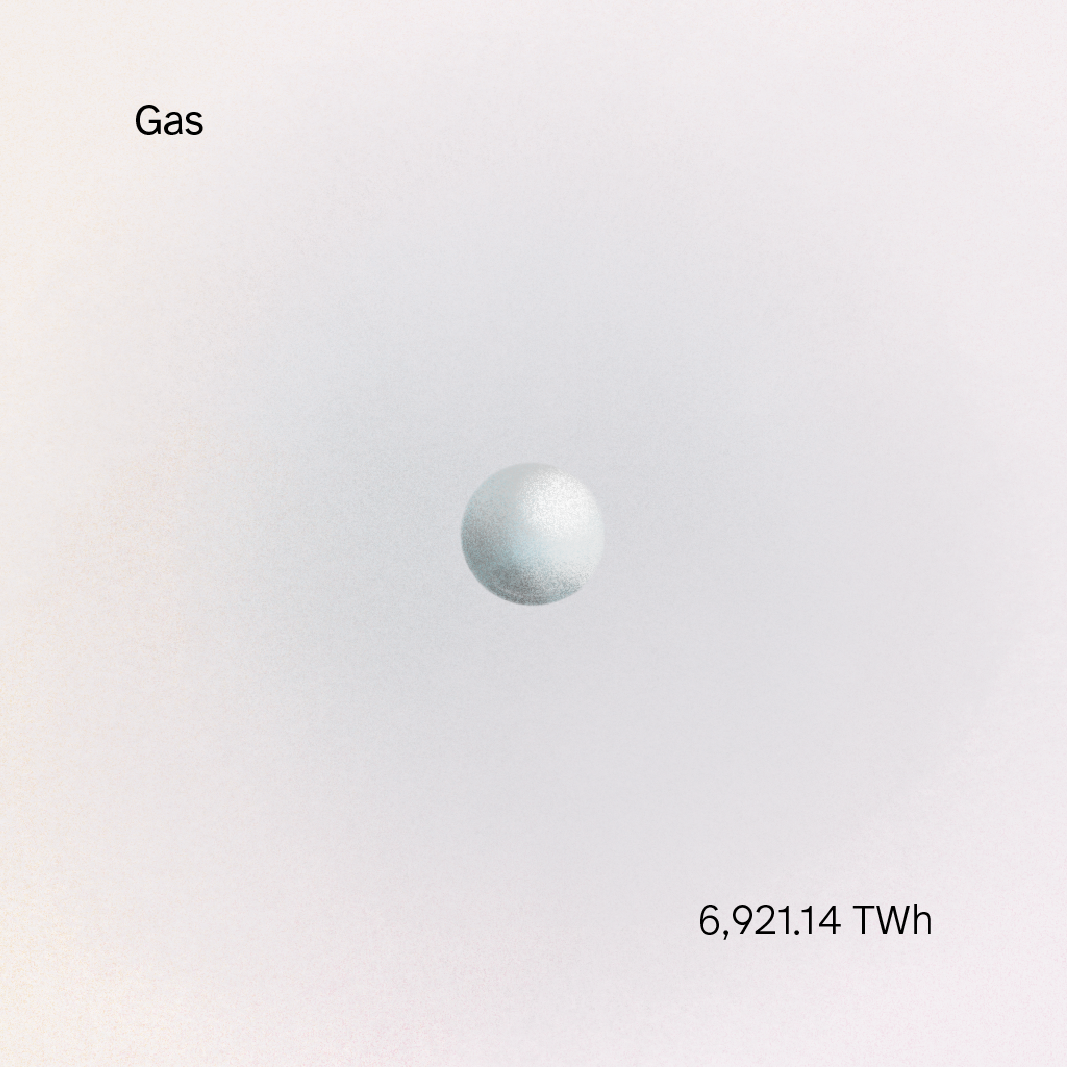
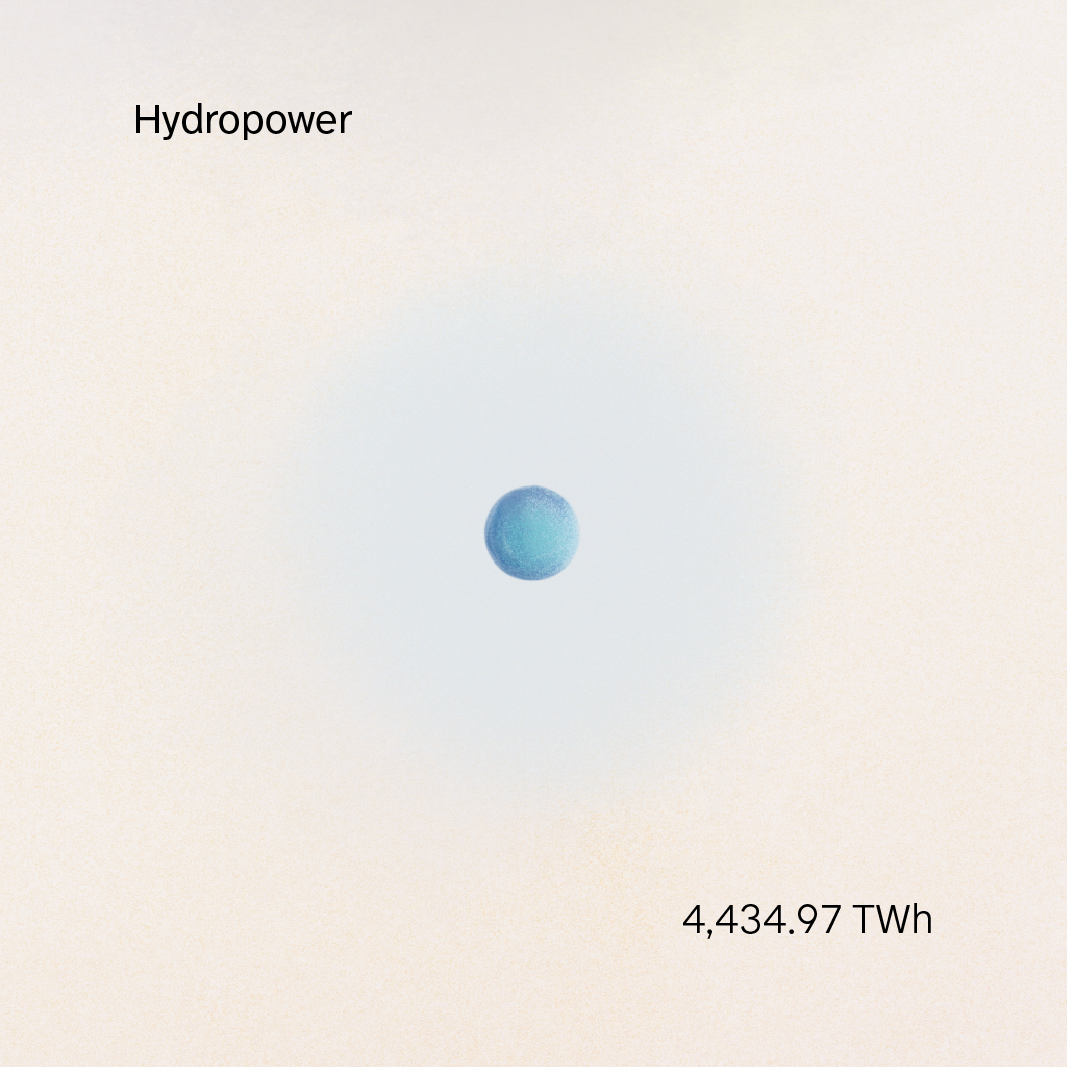
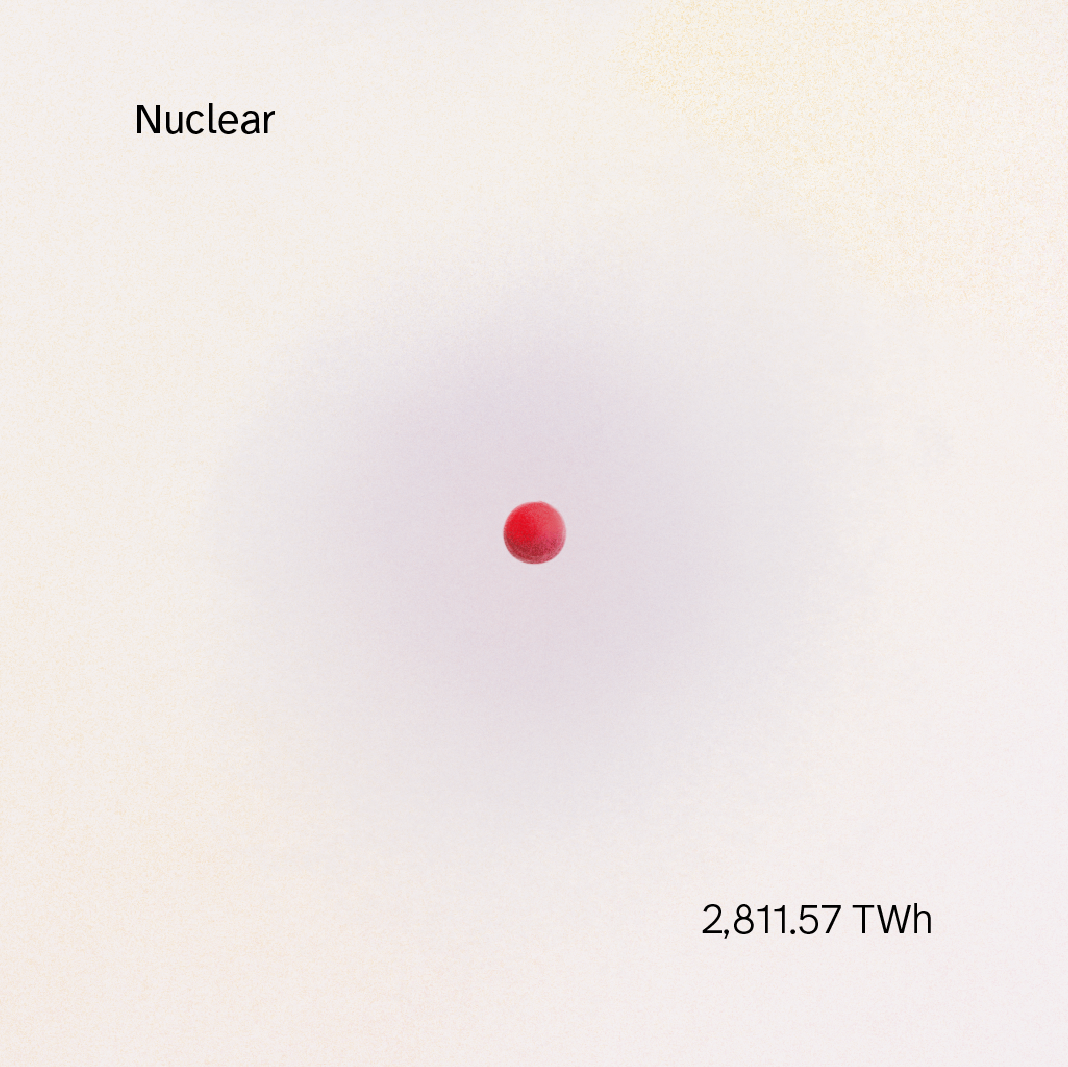
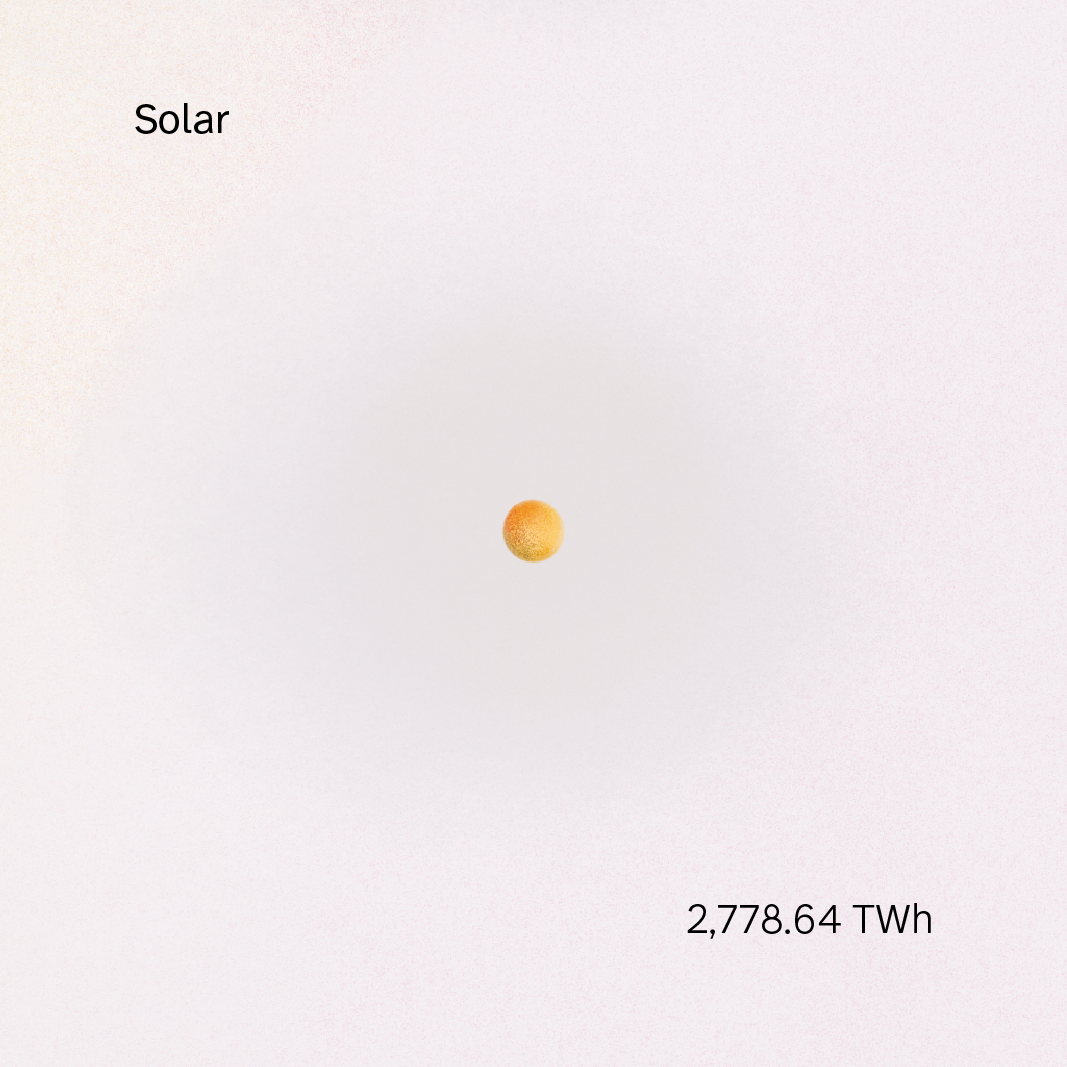
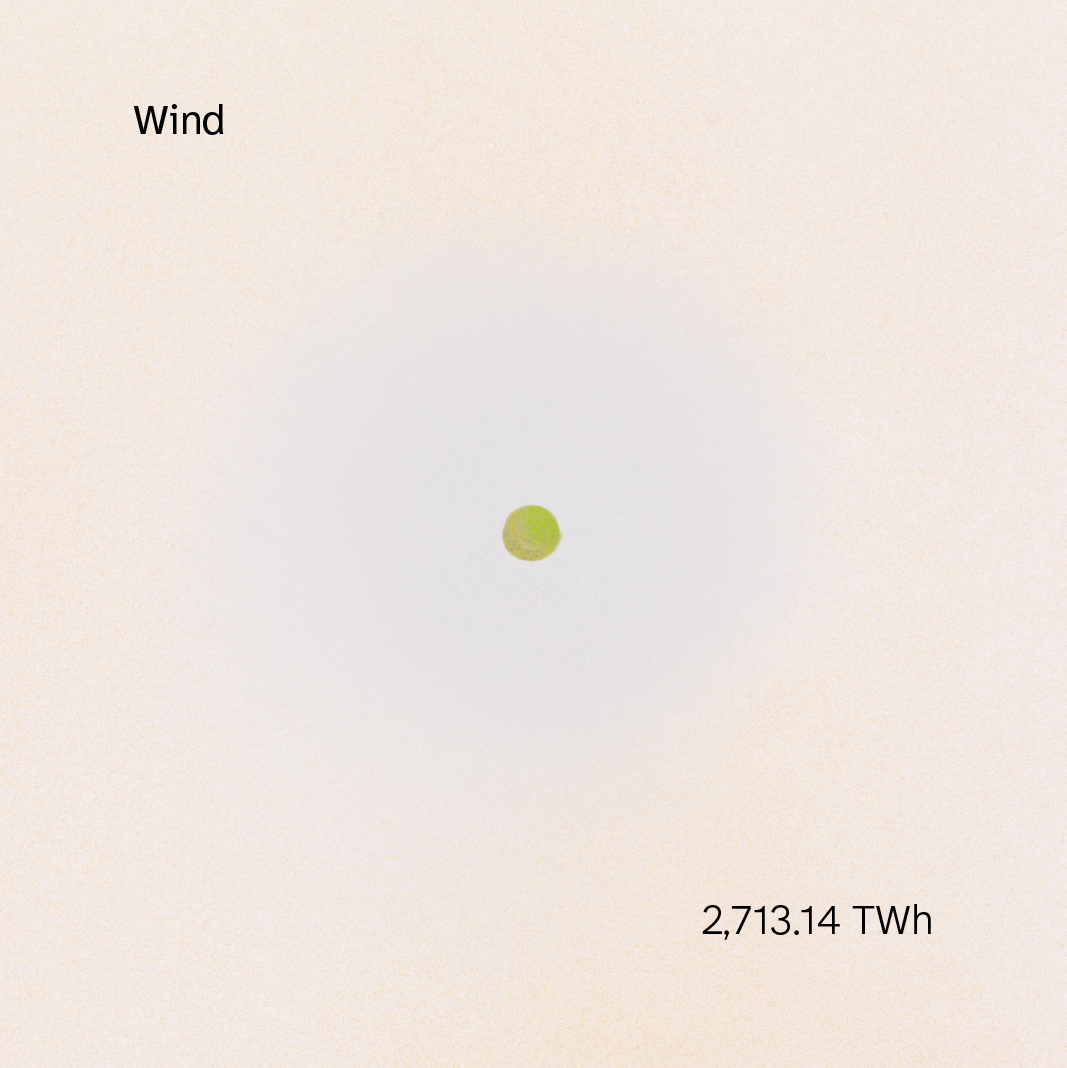
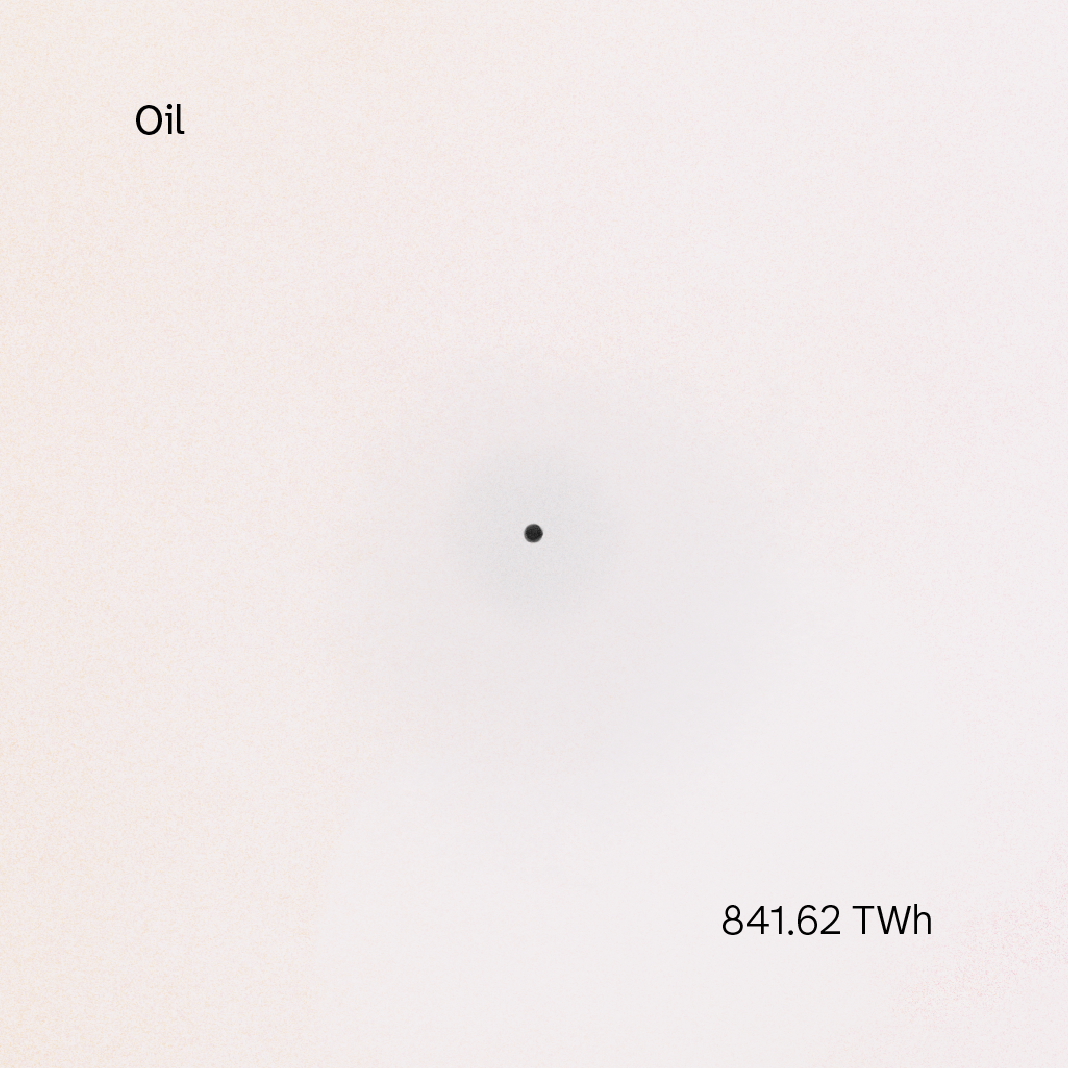
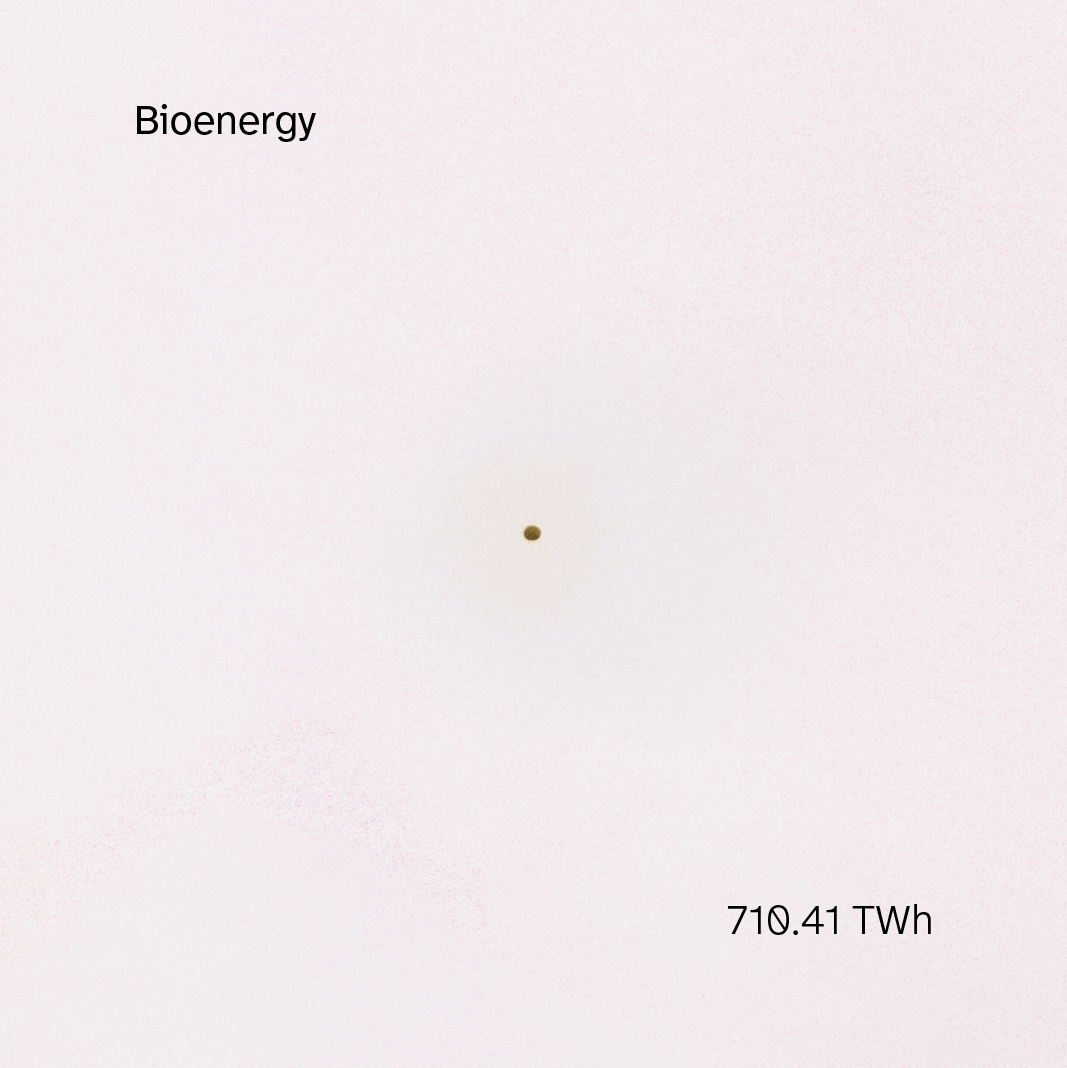
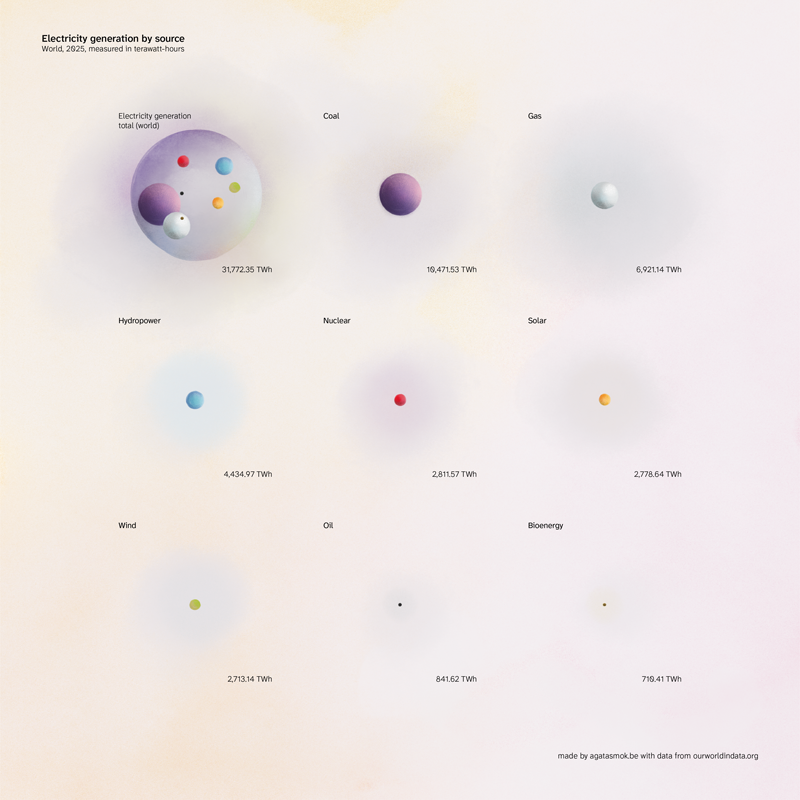
A week ago I finished a course with Gabrielle Merite, whose work I've admired for a long time. My homework to myself was to stop drawing data as a chart. I took electricity generation by source (in the world, 2025) from Our World in Data (31,772 TWh in total) and turned each source into a sphere. First they all float together in one translucent bubble. Then each gets its own page, alone in empty space, with its number tucked in the corner.
Three things I noticed while making it:
Weight is felt, not read. "10,471 TWh" is a figure. A big purple sphere pressing against the edge of the bubble is a feeling. Coal is still about a third of everything, and we don’t need a percentage label for that to register.
Closeness is felt, too. Nuclear, solar and wind (2,812, 2,779 and 2,713 TWh) are practically the same size. A bar chart says this as here there are little spheres nearly identical in size. In 2025 some numbers almost vanish away, in contract with others. You have to go looking for them, and that says something too.
Play gets attention. We engage when something makes us feel something, whether that's curious, delighted or a bit surprised. These hand-drawn spheres are simply another way of showing what a stacked bar shows. And there are so many other ways!
This connects to something I've been thinking about lately.
In 1979, Carol Weiss found that research rarely works the way we assume. Policymakers don't read a report and then apply it. Knowledge seeps in slowly and reshapes how problems are understood, which she called the enlightenment function. If influence is that diffuse, one flagship report isn't enough. I believe that we need a continuous, coherent ambiance of information, not an event but a practice.
A single illustration like this will most likely not change anything on its own.. Yet those small experiments, made often and shared generously, are how a practice starts.
Other things:
Weiss, C. H. (1979). The many meanings of research utilization. Public Administration Review, 39(5), 426–431.